
- Real example: 69,669 impressions, 31,351 eyes-on, 21 ZIP codes and 171 streets in 8 hours on a Cincinnati game day.
- Impressions count opportunities to see; eyes-on adjusts for whether people likely looked. Ask which one a provider reports.
- Density, speed, time of day and nearby events drive the count more than anything else.
- Industry claims of 30,000–200,000+ daily impressions per truck use different methods. Compare like with like.
- The widely repeated “97% recall” figure traces to older industry studies whose methods aren’t public. Measure your own results.
Real data: one LED truck, one Cincinnati game day
On Sept. 13, 2026, one LED truck ran an 8-hour route around the Bengals home opener. The route covered Paycor Stadium, The Banks entertainment district and the I-75 / Fort Washington Way corridor.
| Metric | Result |
|---|---|
| Date and hours | Sun., Sept. 13, 2026, 8:30 a.m.–4:30 p.m. (8 hours) |
| Truck | 1 digital LED truck |
| Impressions | 69,669 (about 8,700 per hour) |
| Eyes-on impressions | 31,351 (about 45% of impressions) |
| Geographic reach | 21 ZIP codes, 171 streets |
| Anchors | Paycor Stadium, The Banks, I-75 / Fort Washington Way |
Read the full write-up in our Cincinnati game-day impressions report. A game day is a high-density case. A weekday suburban route will typically deliver fewer impressions per hour.
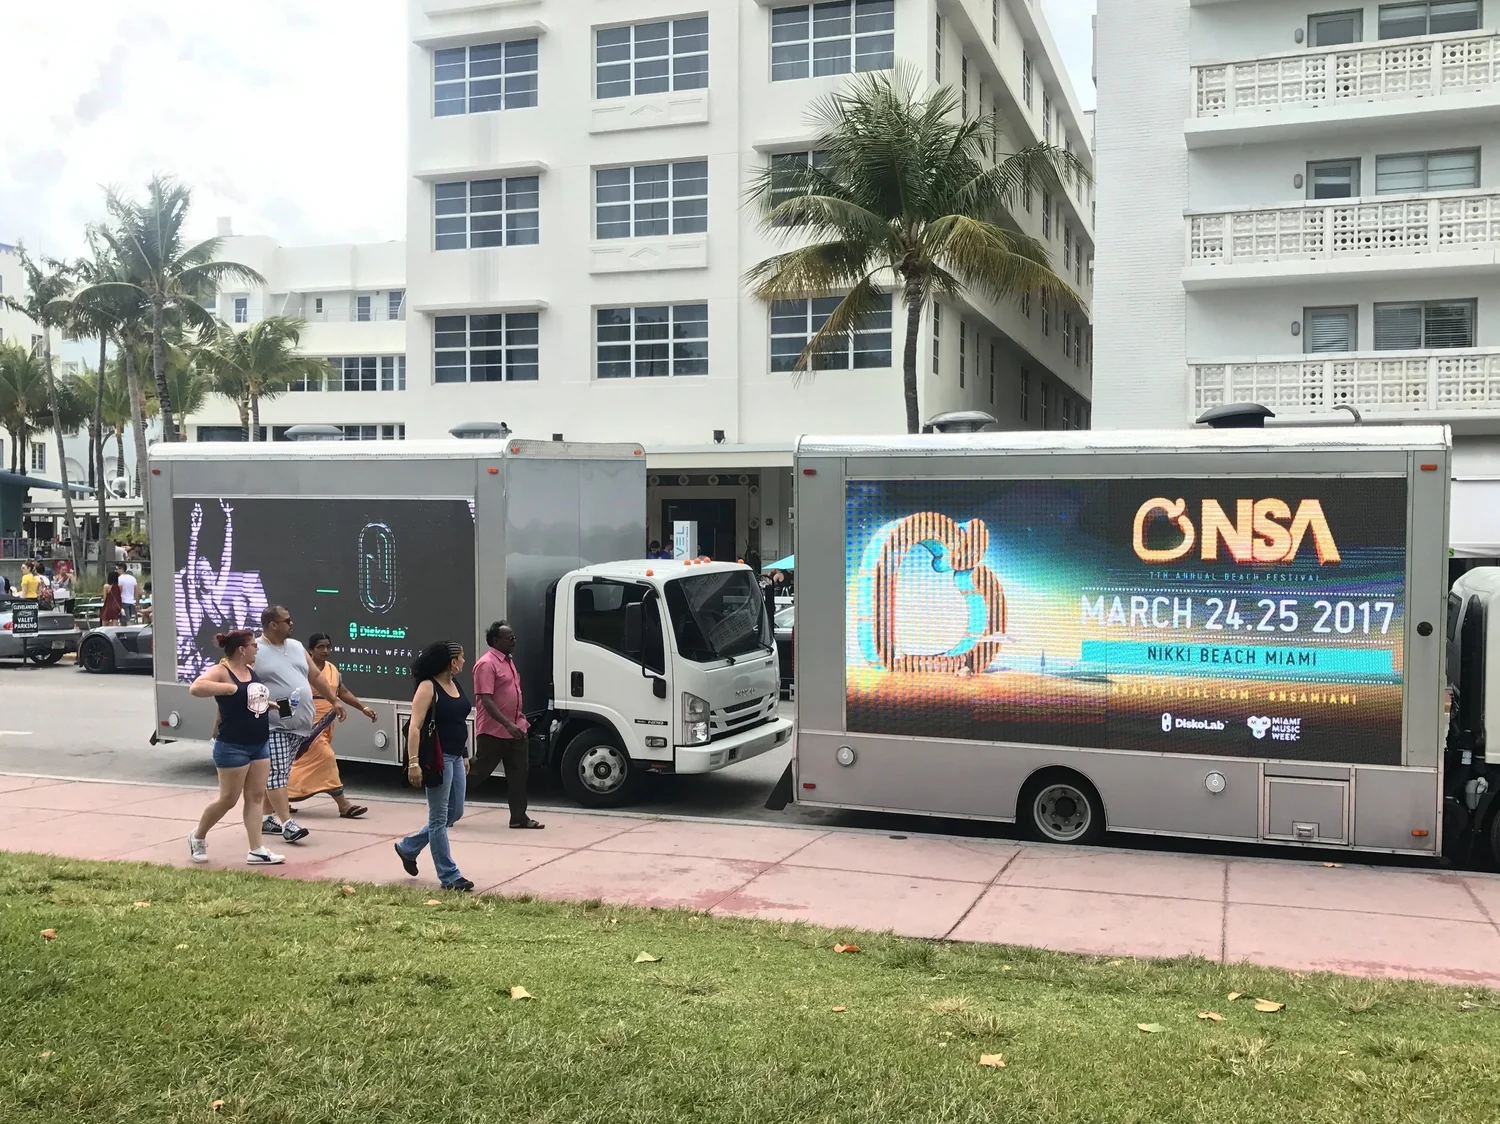
Impressions vs. eyes-on vs. reach
- Impressions (opportunities to see): the number of times people passed within viewing range of the truck. One person passing twice counts twice.
- Eyes-on impressions (visibility-adjusted): impressions discounted for how likely people were to actually look, based on angle, distance, speed and screen size. This is the standard the out-of-home industry’s measurement body, Geopath, and global measurement guidelines use for fixed media.
- Reach: the number of different people exposed at least once.
- Frequency: how many times the average person was exposed.
If a provider gives you one big number, ask which of these it is.
What drives a mobile billboard’s impression count
- Density. More vehicles and pedestrians per block means more impressions per mile.
- Speed. Slow traffic gives each viewer more seconds with the screen, which raises eyes-on.
- Time of day. Commute peaks, lunch and event let-outs beat mid-afternoon lulls.
- Events. Stadiums, festivals and conventions concentrate crowds. That’s why game-day routes outperform typical days.
- Screen size and sides. Our LED trucks carry two 7 × 14 ft side screens and a 7 × 7 ft rear screen, visible from three directions.
- Brightness. LED screens and illuminated banners keep delivering after dark.
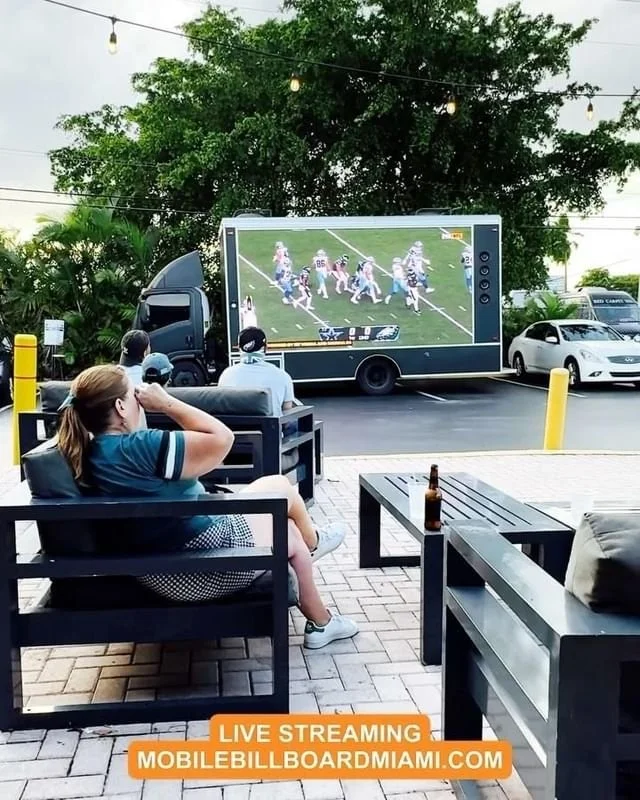
Parked time is where local rules bite. Check our mobile billboard laws guide before planning stationary stops, and see how dense routes look in our Atlanta guide.
How mobile billboard impressions are measured
Good measurement starts with knowing exactly where the truck went, minute by minute. A sound impression model follows five steps:
- Route log. The truck’s tracking system records location, time and speed throughout the campaign.
- Audience counts. Each street segment and district is matched with traffic and pedestrian volume for that time of day.
- Visibility adjustment. Counts are discounted for viewing angle, distance and speed to estimate eyes-on.
- Event adjustment. Crowd levels around venues on event days are factored in.
- Report. Totals by hour, district and ZIP code, so you can match exposure to sales or sign-ups.
Clients get a plain-language report: where the truck went, when, and what it delivered.
The benchmarks you’ll see quoted
Treat published per-truck figures as marketing ranges, not measurements of your campaign. National operators commonly advertise anywhere from 30,000 to 200,000+ daily impressions per truck. Those figures use different methods, hours and markets. The only number that matters is what your route delivered, measured the same way every time.
About that “97% recall” statistic
You’ll see “97% recall” on almost every mobile billboard website. It’s commonly attributed to industry sources from the early 2000s, such as trade-group and magazine studies, and the original methods and samples aren’t publicly available. We don’t think buyers should base a budget on it. Base it on measured delivery and your own response tracking instead.
Questions to ask any provider about impressions
- Is the number total impressions or visibility-adjusted eyes-on?
- What traffic and pedestrian data feeds the estimate?
- Do you adjust for speed, angle and screen size?
- Will I get results by hour and by ZIP code?
- Is the method the same on every campaign, so I can compare runs?
- How are event-day crowds factored in?
Turning impressions into results
Impressions are an input. Customers are the outcome. Pair every campaign with at least one response tracker:
- A QR code with UTM tags, held on screen during slow or parked moments.
- A promo code or tracked phone number used only on the truck.
- Branded-search clicks in Google Search Console during vs. before the campaign.
- Sales or sign-ups by ZIP code, matched to the route report.
Then calculate cost per thousand eyes-on and break-even customers with the formulas in our 2026 cost guide and mobile vs. static ROI comparison.
Frequently asked questions
How many impressions does a mobile billboard get per day?
It depends on the route. One tracked 8-hour Cincinnati game-day route delivered 69,669 impressions and 31,351 eyes-on impressions. Dense event districts deliver more; quiet suburban routes deliver less.
What are eyes-on impressions?
Eyes-on impressions are visibility-adjusted: they discount total impressions for viewing angle, distance, speed and screen size to estimate how many people likely looked at the ad.
Are mobile billboard impressions verified?
The truck’s route is recorded minute by minute, which verifies where and when it ran. Impressions are then modeled from traffic and pedestrian counts on those streets at those times.
Do LED trucks get more impressions than static trucks?
On the same route, impression counts are similar because the same people pass. LED screens can raise attention after dark and with motion, and they can rotate several messages.
Is the 97% recall rate for mobile billboards real?
The figure is widely repeated, but it is commonly traced to early-2000s industry studies whose methods aren’t publicly available. Use measured delivery and your own response tracking instead.
What report do I get after a campaign?
A plain-language summary of where and when the truck ran, with impression and eyes-on totals by hour and district, so you can compare exposure with sales or sign-ups.
About the author: Steven B. is the founder and CEO of Mobile Billboard Global, an Atlanta-headquartered mobile billboard company with 15 years in business, 178 billboard units and more than 34,000 campaign hours completed across U.S. markets. Questions? Call (404) 382-9805 or email Booking@mobilebillboardglobal.com.